









Used EV Battery Health: What SOH Numbers Really Tell You

Used EV battery health comes down to state of health (SOH): a 2022 car at 94% SOH will lose roughly 6% of its original range, while one at 82% loses 18%. That gap is worth several thousand dollars and is invisible on a test drive.
SOH is the measured capacity of the pack today against its rated capacity when new. Everything else — the dashboard percentage, the predicted range, the seller’s claim that it “still does 400 km” — is a derived guess.
What is a normal SOH for a used EV?
For LFP packs, expect 93-96% at 40,000 km, 90-93% at 80,000 km, and 87-90% at 130,000 km. Degradation is front-loaded — the first 3-5% disappears quickly, then the curve flattens.
Older ternary packs behave differently: 90-93% at 40,000 km is normal, but they fall faster after 100,000 km and are more sensitive to heat and fast charging.
Why do two cars with identical mileage show different SOH?
Charging behaviour. A car DC fast-charged daily sits 3-6 points lower than one charged overnight at 7 kW, at the same odometer reading. Climate matters too: a pack kept in 40°C for three summers ages roughly twice as fast as one in a temperate city.
This is why mileage is a weak proxy. A 90,000 km car with home charging can beat a 45,000 km car that lived on public chargers.
What does 90% SOH actually mean in range?
- 2022 Atto 3, 510 km CLTC at 100% → about 460 km at 90%, and roughly 360-380 km realistic. Example: 2022 Atto 3 Flagship.
- 2024 Leapmotor C11, 580 km CLTC at 95% → about 550 km, roughly 430 km realistic. Example: C11 580 Premium.
- 2023 Tesla Model 3, 606 km CLTC at 92% → about 557 km, roughly 440 km realistic. Example: Model 3 Highland.
- 2019 BYD e2, 405 km NEDC at 88% → about 356 km NEDC, so around 280 km real. Example: 2019 e2.
How do sellers game the SOH number?
Three known tricks. A BMS recalibration right before the scan can temporarily raise the reported figure. Some apps report “available capacity” rather than measured capacity. And a scanner reading a single module’s health instead of the pack’s will look better than reality.
The fix is verification, not suspicion: ask for the raw cell data, not a summary. Cell voltage spread under 30 mV at rest is healthy; above 60 mV suggests a weak module.
How can I test a battery myself?
- Charge to 100%, note the kWh added from a known starting point.
- Drive 60-80 km on a fixed route, record distance and kWh consumed.
- Divide usable energy by consumption to get real range.
- Recharge and compare kWh taken against the rated pack size.
- Watch whether range drops abruptly at low SOC — a “cliff” below 10% points to imbalance.
That test takes an afternoon and settles the argument better than any document the seller hands you.
When should a battery report kill the deal?
Below 85% on a car under 50,000 km: something happened. Below 80% at any mileage: the price has to fall by 20-30% to reflect the loss, and resale in your country will be hard.
If the car is still under an 8-year/160,000 km warranty to 70%, SOH in the high 70s may qualify for a replacement pack in some markets. That is a real value play — but only for buyers willing to run the claim.
Key Takeaways
- SOH measures current capacity against rated capacity; it is the single best predictor of a used EV’s value.
- 90-96% is normal for LFP packs at 40,000-80,000 km; ternary packs drop faster after 100,000 km.
- Charging habits and climate move SOH by 3-6 points at the same mileage.
- Ask for raw cell data: voltage spread under 30 mV means the pack is balanced.
Related Vehicles

2022 BYD Yuan PLUS (Atto 3) 510km Flagship (204HP FWD) Electric Compact SUV
- 2022
- 56,000 km
- Automatic
- Electric
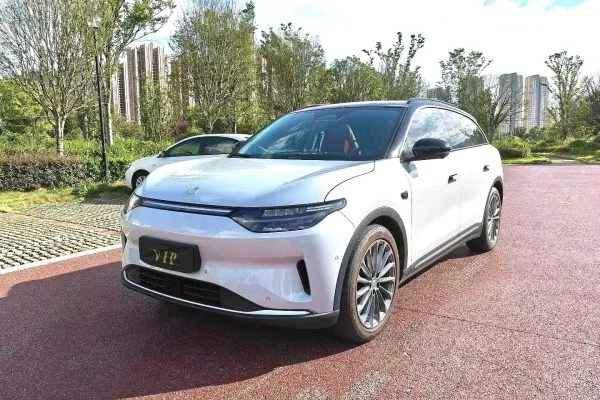
2024 Leapmotor C11 580 Premium Edition for Sale – 272 hp EV, 580 km Range, Export Ready
- 2024
- 21,000 km
- Automatic
- Electric
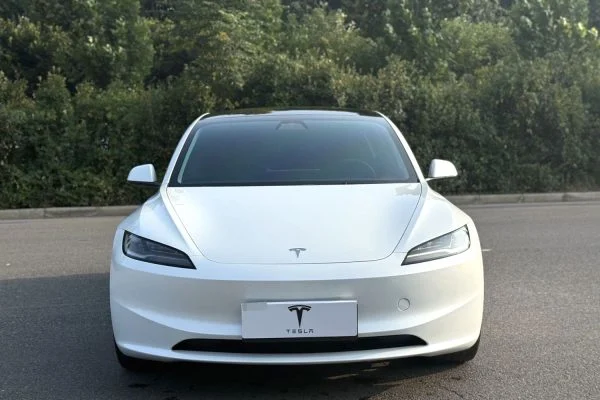
2023 Tesla Model 3 Highland RWD for Sale – 264 hp EV, 606 km Range, Export Ready
- 2024
- 60,000 km
- Automatic
- Electric

2023 BYD Song PLUS EV Champion Edition 520km Flagship (204HP FWD / Seal U) Electric SUV
- 2024
- 4,000 km
- Automatic
- Electric